From Chaos to Clarity: The Real-World Power of Data Engineering
- Luis agudelo
- Apr 14, 2025
- 3 min read


Introduction: Why Data Engineering Matters
Story: The E-Commerce Data Mess
I was once asked to help an e-commerce team answer some critical business questions:
What's our best-performing product?
Which category drives the most sales?
What types of customers are buying what?
It should’ve been easy. But the data I got was a mess:
Eight different Excel files
Order data in one, products without categories in another
CRM exports with customer data, but no product links
VIP customers manually highlighted with colors
Different formats. Mismatched columns. Missing values. The business was drowning in data, but starving from insight!
By the time I finished cleaning and aligning everything, the marketing team had already launched their next campaign—blindly repeating old patterns and hoping for better results.
Takeaway: You can’t get value from data without structure, consistency, and automation. That’s what data engineering brings to the table.
Data Quality, Reference Data & Master Data Management
Reference Data
Reference data is standard, agreed-upon lists that ensure consistency across systems. Examples include:
Countries ("AE" for UAE, "US" for the United States)
Currencies ("USD", "EUR", "AED")
Languages (“EN”, “NL”, “ES”)
Real-Life Issue: Different systems labeled currencies inconsistently—"AED", "Dirham", "DH"—none of which followed ISO standards.
Solution: We created a centralized reference data catalogue to standardize and map values.
Master Data
Master data refers to core business entities like customers, suppliers, and products that appear across multiple systems.
Real-Life Issue:
Finance had "ACME Ltd"
CRM listed "ACME Corp"
IDs were inconsistent or duplicated
Solution: We introduced a master data catalogue and ID mapping table. We didn’t enforce a single ID across all systems—instead, we created mappings like:
Master ID | Finance ID | CRM ID | Sales ID |
CUST12345 | FIN1001 | CRM_678 | ACME_CO |
Takeaway:
Reference data = standard vocabularies
Master data = unified identities across systems
ID mappings = relate different records without needing a global ID
From Reports to Insights
Data engineering powers the journey from raw files to business-changing insights. Think of it in two broad phases:
1. Get the Data: Collect, clean, and centralize data.
2. Use the Data: Explore, analyze, and model it.
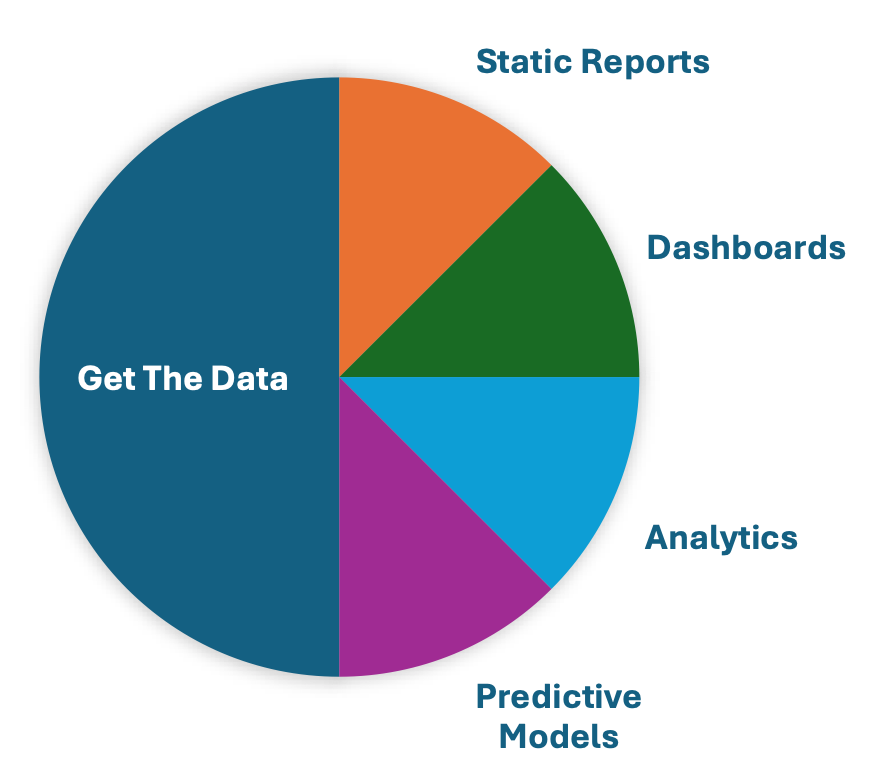
Using the data often fits into one of the following categories:
Static Reports | PDFs/spreadsheets | Standard Reports on an scheduled basis |
Dashboards | Filterable dashboards | Ask questions by clicking |
Analytics | Exploratory SQL/Python | Answers “why”. Ask your own questions |
Predictive Models | Forecasting, ML models | Answers “what might happen”. Future looking |
Moving Data: ETL, ELT & Reverse ETL
ETL (Extract, Transform, Load)
Clean and transform data before storage. Example: API → Clean → Data Warehouse
ELT (Extract, Load, Transform)
Load raw data first, then transform within the warehouse. Useful in BigQuery, Snowflake, etc.
Reverse ETL
Push cleaned data back into CRMs, analytics tools, or marketing platforms.
Where Data Lives: Data Lakes, Warehouses, and Marts
Data Lake: Stores raw, unstructured data (logs, images)
Data Warehouse: Structured, cleaned data for querying and reporting
Data Mart: Department-specific subset of warehouse (e.g., Marketing-only views)
Analogy:
Lake = All water (raw)
Warehouse = Bottled water (ready)
Mart = Fridge in your team’s room
Batch vs Stream Processing
Batch Processing
Collect and process data in chunks
Example: Daily ETL job at 2 a.m.
Stream Processing
Handle data in real-time
Example: Detect heart rate anomaly from wearables instantly
Data Value Over Time:
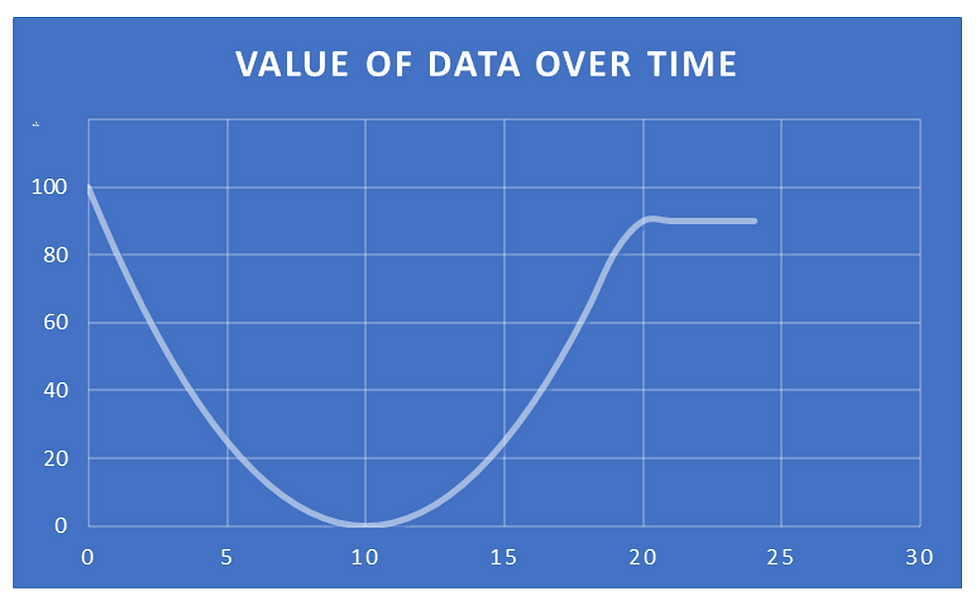
Now – Real-time data (factory alarm, high-value immediately)
Short-Term – Slightly delayed, low-use
Later – Aggregated and contextualized for forecasting and analysis
Database Design: OLTP vs OLAP / Cubes
OLTP (Online Transaction Processing) | OLAP (Online Analytical Processing) and Cubes |
Write-optimized (e.g., PostgreSQL, MySQL) | Read-optimized (e.g., Snowflake, BigQuery), Tabular Model Cubes |
Real-time transactions | Dashboards, trend reports |
Like note-taking | Like reading executive summaries |
A Day in the Life of a Data Pipeline
Use Case: Launching the New Range Rover Sport
Target audience: Married, 30–45 years old, high-income, 2+ kids, countryside lifestyle, interest in fishing
Pipeline Steps:
Data Sources: Google Analytics, cookie-level data, web, CRM, dealership systems, third-party enrichment platforms, Facebook, Twitter, social media engagement, event RSVPs, and sentiment analysis data
ETL/ELT: Extract, match IDs, enrich with lifestyle and behavioral data, transform
Storage:
Data Warehouse for cleaned journeys
Data Lake for logs, engagement streams, and sentiment
Dashboarding: Show personas, drop-off rates, geographic and behavioral insights
Reverse ETL: Push segments back into ad systems for retargeting (personalized by language, hobby, income)
Results:
RSVPs up 28%
Test drive bookings up 19% in targeted segment
Takeaway: Insights like these are only possible with good data engineering.
Wrap-Up: What We Covered
Why data engineering matters
Data quality, reference data, and master data
ETL, ELT, Reverse ETL
Data lakes vs warehouses
Batch vs stream processing
OLTP vs OLAP / Cubes
Real-world pipeline in action
Final Note: Data engineering transforms chaotic, disconnected data into valuable, actionable insights—by making it clean, connected, and queryable.
What part of this pipeline are you most excited to explore?


Comments